🛠️Asset Intelligence Dashboard for Utilization & Financial Optimization (Using Sisense and MySQL)
- Justin Nguyen
- Sep 13, 2025
- 6 min read

Updated: Sep 15, 2025
📘 Background Summary
This project was initiated during my tenure at a previous company, commissioned by a client in the infrastructure and heavy equipment sector. The goal was to develop a comprehensive asset reporting and management tool designed to track, analyze, and forecast:
Asset utilization across categories (e.g., dozers, excavators, generators)
Financial performance tied to hire models and operational metrics
Maintenance status and downtime trends
The system was built to empower asset managers with real-time visibility, enabling data-driven decisions around asset allocation, contract structuring, and revenue optimization. It also supported granular reporting for billable vs. non-billable hours, cost breakdowns by business unit, and predictive insights for future utilization.
👥 Who Is This Project For?
This solution was developed for a mid-tier civil construction and plant hire company operating across multiple project sites. Their operations involved both wet and dry hire models, with a diverse fleet of machinery and a growing need for:
Transparent financial tracking across assets and contracts
Proactive maintenance scheduling
Improved forecasting for asset deployment and ROI
The primary users included:
Asset Managers
Finance and Operations Teams
Project Coordinators
Executive Leadership seeking strategic insights
💡 Business Questions Addressed
The dashboard was designed to answer several critical business questions:
Utilization & Efficiency
Which assets are underperforming or underutilized?
What percentage of time are assets billable vs. idle or under repair?
Financial Performance
How does asset utilization correlate with revenue generation?
What are the monthly and quarterly repayment obligations by lender and asset?
Maintenance & Downtime
Which assets are driving high maintenance costs or frequent breakdowns?
Can we forecast downtime and optimize repair schedules?
Contract & Hire Model Optimization
Are wet hire contracts more profitable than dry hire in specific categories?
How can we better align contract terms with asset availability and performance?
Forecasting & Planning
What does the next 120 days of utilization look like across the fleet?
Which assets should be prioritized for redeployment, sale, or upgrade?
🧩 Data Architecture & Processing
To support scalable reporting and efficient querying, I designed and implemented a denormalized data model tailored for business intelligence and dashboard integration. This involved restructuring key operational tables into fact and dimension pairs, following a star-schema approach:
✅ Plant Table
Denormalized into Fact_Plant for transactional and utilization metrics
And Dim_Plant for descriptive attributes like asset type, category, and status
🔧 Plant Service Table
Split into Fact_Plant_Service to capture service events, timestamps, and costs
And Dim_Plant_Service to store service types, categories, and metadata
⚠️ Defect Table
Transformed into Fact_Defects for damage incidents, severity, and resolution timelines
And Dim_DefectTypes / Dim_DefectStatuses for classification and status tracking
Fact Tables:
Fact_Plant_Entity: Core asset records
Fact_Plant_Finance: Financial transactions and repayments
Fact_Plant_Utilization: Hourly and monthly usage metrics
Fact_Plant_Service: Maintenance and service logs
Fact_Defects: Damage and defect reporting
Dimension Tables:
Dim_Plant, Dim_PlantGroup, Dim_PlantStatus: Asset classification and status
Dim_Company, Dim_Region: Organizational and geographic context
Dim_Date: Time-based filtering and aggregation
Dim_DefectTypes, Dim_DefectStatuses: Categorization of damage reports
Dim_Plant_Financial, Dim_Plant_Service: Financial and service metadata
📊 Key Insights
I. Working Utilization Dashboard
Link to Dashboard: Dashboard/Portfolio DA/Plant/Plant Working Utilisation.pdf at main · JustinNguyennn/Dashboard


1. Utilization Volume & Efficiency
Total Recorded Hours exceed 1.1 million, with 531 plants released and 389 services completed, indicating high operational throughput.
However, Total Spend ($227K) appears modest relative to hours logged — this may suggest:
Cost efficiency in operations
Or underbilling/low monetization of utilization hours
2. Status & Ownership Breakdown
89% of plants are “Ready for Hire”, and 95% are company-owned, showing:
Strong asset availability
Minimal reliance on external suppliers
This supports agile deployment but also implies full responsibility for maintenance and downtime.
3. Utilization by Category & Parent Group
Bar charts show wide distribution across categories like Attachments, Generators, Tools, and Vehicles.
Parent categories such as All Access, All Material, and All Traffic dominate, suggesting:
These asset groups are central to project delivery
Potential prioritization for maintenance and investment
4. Downtime & Maintenance Trends
Line charts reveal:
Downtime spikes for specific machines (e.g., Bridging Machine 4 & 6)
Consistent service activity over time, with breakdowns and repairs tracked monthly
Horizontal bar charts identify top downtime contributors:
Plant Class 23-07 and EGR - Kamumba (F1000) show the highest downtime hours
Insight: These assets may be aging or misaligned with operational demands — candidates for replacement or deeper diagnostics.
5. Utilization by Client & Plant
Some clients and plants show significantly higher working hours, indicating:
Uneven workload distribution
Opportunity to rebalance asset deployment or renegotiate client terms
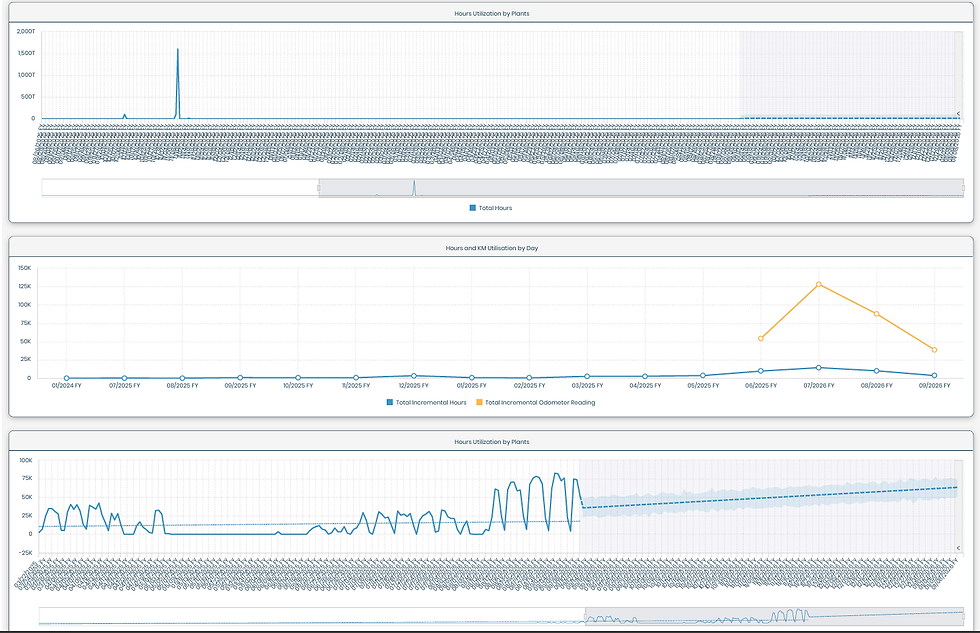
6. Temporal Utilization Patterns
Multiple line graphs show:
Spikes in utilization around late May and early June
Gradual increases in transmitted and recommended hours
A consistent upward trend in overall utilization by month
Interpretation: These patterns may reflect seasonal project cycles, onboarding of new assets, or improved scheduling efficiency.
II. Plant Service
Link to dashboard: Dashboard/Portfolio DA/Plant/Plant Service.pdf at main · JustinNguyennn/Dashboard

1. Service Compliance Gaps
The largest category in the service status chart is “Plant Never Serviced”, indicating a significant portion of assets have no recorded service history.
This raises potential risks around:
Safety compliance
Unexpected breakdowns
Warranty voiding or insurance exposure
Actionable Insight: Prioritize onboarding these assets into the service schedule and investigate why they’ve been excluded — possibly due to data gaps or operational oversight.
2.Overdue Maintenance Risk
A notable number of plants fall under “Service Overdue”, suggesting:
Maintenance schedules are not being adhered to
There may be resource or scheduling constraints
Strategic Opportunity: Introduce automated alerts or service forecasting to prevent overdue accumulation and reduce reactive maintenance costs.
III. Finacial Utilization
Link to Dashboard: Dashboard/Portfolio DA/Plant/Plant Financial Utilisation.pdf at main · JustinNguyennn/Dashboard

1. Service Costs vs. Sales Revenue
Service Costs: $22,200
Total Sales Invoices: $23,375.94
The margin between service costs and sales revenue is only ~$1,175, suggesting:
A tight operating margin
Potential underpricing of services or high service overhead
Actionable Insight: Consider reviewing pricing models or service delivery efficiency to improve profitability.
2. Missing Invoice Imports
The metric “Sales Invoices Imported” shows #N/A, indicating:
A data integration issue
Or a gap in syncing external invoice systems
Risk: This could lead to incomplete financial reporting or missed revenue recognition.
Recommendation: Validate ETL pipelines or API integrations to ensure invoice data is consistently captured.
3. Temporal Trends in Revenue
The line graph shows two major spikes in Sales Invoices Imported:
Around June 2020 and September 2020
These peaks may correspond to:
Seasonal demand
Project milestones or bulk billing cycles
Opportunity: Use these patterns to forecast future revenue cycles and align resource planning accordingly.
4. Flat Service Cost Curve
Service costs remain relatively flat over the two-year period, suggesting:
Stable maintenance or operational expenditure
Or lack of dynamic cost tracking tied to asset usage
Optimization Tip: Consider linking service costs to utilization metrics to better understand cost-per-hour or cost-per-asset.
IV. Repair & Maintenance
Link to dashboard: Dashboard/Portfolio DA/Plant/Plant Repair & Maintenance.pdf at main · JustinNguyennn/Dashboard
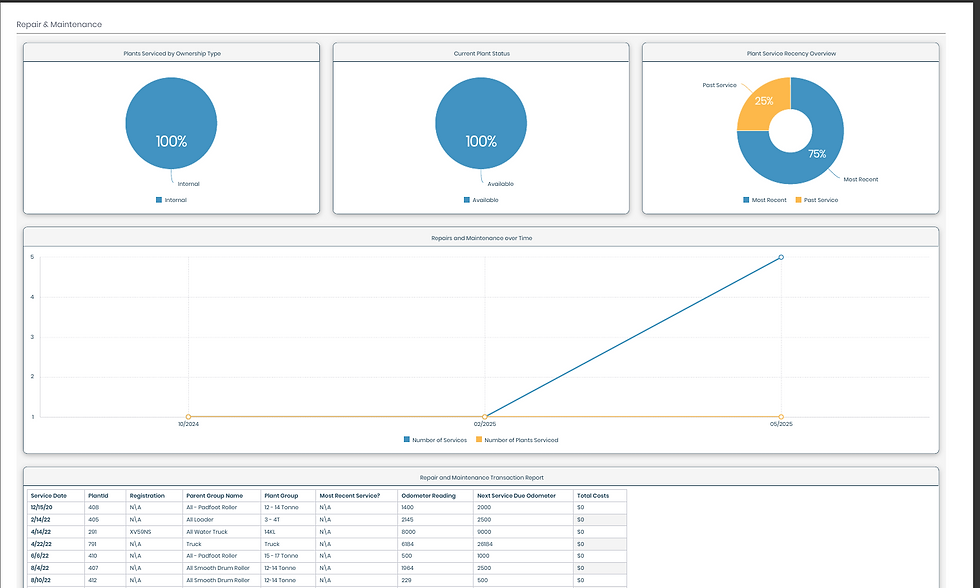
1. Service Coverage & Recovery Status
🔧 50% of plants are recently serviced, while 25% remain unserviced. This split highlights a partial recovery in service coverage, but also flags a quarter of the fleet as potentially at risk due to missed or delayed maintenance.
2. Operational Readiness
✅ 100% of plants are currently available and internally owned, indicating full control over asset deployment and no external dependency. This simplifies scheduling but places full responsibility for upkeep and performance on internal teams.
3. Maintenance Activity Trend
📈 Between 02/02/24 and 03/02/24, the number of services and plants serviced increased, showing a positive uptick in maintenance engagement. However, recorded service costs remain at $0, suggesting either missing financial entries or untracked expenses that could distort cost analysis.
V. Plant Workshop
Link to dashboard: Dashboard/Portfolio DA/Plant/Plant Workshop.pdf at main · JustinNguyennn/Dashboard

1. Issue Backlog & Workflow Bottleneck
🟡 62.5% of issues are still in “To Do” status, indicating a significant backlog in unresolved tasks. This suggests either resource constraints or delays in triaging and progressing workshop issues.
2. Root Cause Concentration
📌 The top status reason is “Recommended”, far exceeding other categories like “Spare Part” or “Awaiting Implementation.”
👉 This implies that many issues are flagged proactively, possibly from inspections or predictive diagnostics — but not yet actioned.
3. Equipment-Specific Pressure
🏗️ Excavators and attachments dominate both issue volume and priority categories, signaling:
High wear-and-tear or operational intensity
A need to prioritize maintenance and parts availability for these asset types


Comments